|
|
Laser
Show Systems - Scanning Systems
ILDA Test Pattern
The information on this
page is from ILDA but it is NOT an official ILDA document.
For the latest version, contact ILDA Directly or visit
the ILDA web site at www.laserist.org
Written by:
Casey Stack, Laser Fantasy International, 1992
Bob Mueller, Laser Fantasy International, 1992
Casey Stack, Lightspeed Design, Inc., 1995
Scott Huggins, Laser Fantasy International, 1995
Revised
October 1996:
William R. Benner, Chairman, ILDA Technical
Committee
Prepared by:Kelly
and Frank Plughoff, Full Spectrum Lasers
Introduction
The
ILDA test pattern very accurately defines mechanical
laser scanner response. The test pattern's primary use is in
alignment and calibration of galvanometer based
laser vector graphic projection systems.
This known response is crucial to proper
reproduction of interchanged imagery. Use this test pattern to calibrate
programming and playback equipment prior to the
commencement of image creation.
The point output rate associated with this ILDA
Standard defines only the rate which must be used
during scanner adjustment. This standard does not effect the point rate
at which subsequent images may be generated or
reproduced.
Original
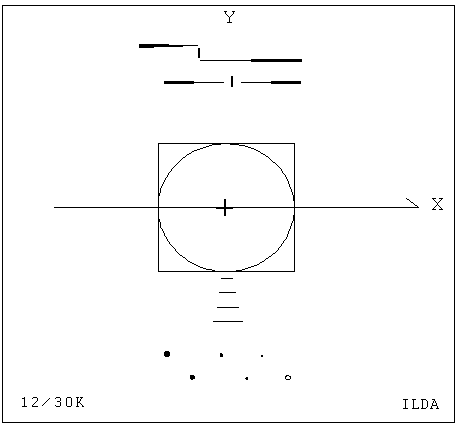
ILDA Standard Test Pattern - ildatest.ild
This
is the original ILDA Standard Test Pattern (figure
1), which is the file entitled ildatest.ild on the
ILDA Technical Standard Disk 1996. This test pattern
can be used to tune to the 12K or 30K standard.
However, since scanners typically cannot reproduce
this test pattern properly with large angels at 30K,
this should be used only at 12K or with a maximum
deflection of 8 degrees at 30K.

Figure 1 - Original ILDA Test Pattern - ildatest.ild
Version
"B" ILDA Standard Test Pattern - ildatstb.ild
This
is Version "B" of the ILDA Standard Test Pattern
(figure 2), which is the file entitled ildatstb.ild
on the ILDA Technical Standard Disk 1996. It
is the original ILDA Standard Test Pattern, scaled
small inside a large box. This test pattern can be
used to tune to the 12K or 30K standard, at
deflection angles of up to 53 degrees. To use it,
display the outer frame at angles up to 53 degrees
and the inner test pattern will remain valid for
tuning. A scan angle of 53 degrees represents a 1:1
(one-to-one) scan angle where the width of the image
equals the distance to the screen.
Figure 2 - Version "B"
ILDA Test Pattern - ildatstb.ild
ILDA
Test Pattern Key

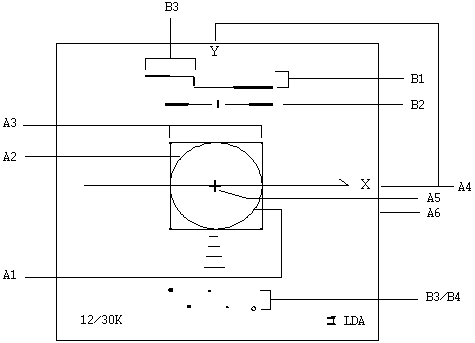
Figure
3 - ILDA Test Pattern key
| A. XY scanner |
B.
Blanking Scanner |
| 1)
Correct scanner speed |
1)
Correct scanner speed |
| 2)
Correct damping |
2)
Correct damping |
| 3)
Same scanner speed |
3)
Amplitude |
| 4)
Inverts |
4)
DC offset |
| 5)
Amplitude |
|
| 6)
Centering |
|
| Note:The 12/30K indicates the output speed for
this test pattern in points per second. Your image source must output points
at 12,000 or 30,000 points per second (+/- 1%) for this test pattern to work. |
ILDA
Test Pattern Tuning Procedure
Adjust
XY Scanners
This
procedure assumes scanners and blanking system are
pre-tuned to a state of stable operation. Consult manufacturer's documentation for
information on scanner start-up from a completely
inoperative state.
Use caution when adjusting scanners. Galvanometer and motor scanners can be easily
damaged through careless or rough adjustment. Tuning should be performed by personnel with
suitable knowledge and experience. Always watch the output carefully, when
images begin to break-up this is a warning that harm
may be near. Never
allow scanners to oscillate! Read manufacturers data on scanner adjustment
carefully before commencing any tuning.
For additional information about use of the ILDA
Test Pattern read, "Using the ILDA Standard Test
Pattern".
1.
Display Test Pattern
Display
the ILDA Test Pattern image at 12,000 (12K) or
30,000 (30K) points per second depending on desired
tuning.
Increase the size of the test pattern until the
inner circle begins to distort. Decrease the test pattern 10% from this size.
To use the test pattern correctly, it must be
scanned small to prevent distortion of the circle.
For 30K tuning this about 8 degrees optical
or less. For
12K tuning this can typically be as large as 15
degrees optical.
2.
Adjust Inverts
Refer
to figure 3; A4.
The Y should appear at the top of the image. The X should appear at the right hand side of
the image. If either of these is reversed, invert the signal at the
driver card or at the source as appropriate.
3.
Adjust Y Damping
Refer
to figure 3; A2.
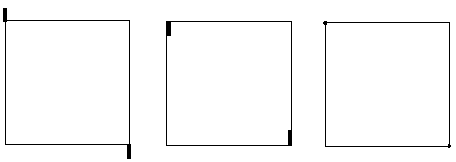
Observe the lower right corner of the inner square,
adjust the low frequency damping until a small
amount of "overshoot" is observed. See figure 4.
The length of this overshoot should equal
approximately 2/3 the height of the word "ILDA"
in the test pattern.
For scanner drivers equipped with only a single
damping control: Perform all adjustments for low frequency damping and omit
high frequency damping procedures.
|
Y Overshoot
Y Undershoot Y Perfect
Figure
4 |
Adjust
the high frequency damping up or down a small
amount. Notice that the overshoot line becomes
slightly longer or shorter as you do this. If you
increase or decrease the high damping too far in
either direction, the overshoot will become longer.
By carefully adjusting in both
directions you will find the point where the
overshoot is at its shortest length.
Use extreme precision and diligence, the perceived
change is very slight. This adjustment is of utmost importance for
proper tuning.
|

Figure 5
|
Return
to the low frequency damping and decrease to "tuck" the overshoot back into the dot at the
corner of the square. Use caution not to create undershoot which is
very difficult to see. See figure 4. If
top and bottom of the circle touch the top and
bottom edges of the square (regardless of the phase
of the circle), skip to step 5, "ADJUST X
DAMPING". See
figure 6.
|

Figure 6
|
4.
Adjust Y Servo Gain
Refer
to figure 3; A1
If top and bottom of circle are smaller, or
inside the square, increase servo gain and return to
step 3, "ADJUST Y DAMPING".
If top and bottom of circle are larger, or
outside the square, decrease servo gain and return
to step 3, "ADJUST Y DAMPING".
5.
Adjust X Damping
Now
that the Y axis is correctly adjusted, do not adjust
it again.
Observe the upper right corner of the inner square.
Adjust the low frequency damping until a
small amount of overshoot is observed. The amount of overshoot should equal
approximately 2/3 the height of the word "ILDA"
in the test pattern.
Adjust the high frequency damping to where the
length of the overshoot line is minimized, as was
done in step 3 for the Y axis.
Decrease the low frequency damping to "tuck" the
overshoot back into the dot at the corner of the
square. Again,
use caution to not go too far and create undershoot.
6.
Adjust X Servo Gain
If
the circle is smaller than the square in the
X axis, increase the servo gain and return to
step 5, "ADJUST X DAMPING".
If the circle is larger than the square in
the X axis, decrease the servo gain and
return to step 5, "ADJUST X DAMPING".
At this point the circle should touch the square at
four points and be perfectly round. If so, go to step 7,
"ADJUST IMAGE SIZE".
|

Figure
7
|
If
the circle touches the square in both axis, but the
circle is not perfectly round, very carefully fine
tune damping
and servo gain with step 5, "ADJUST X damping",
repeatedly, until circle is as round as possible.
If perfect circularity is still not attained, fine
tune adjustments for damping and servo gain
carefully for Y axis again. Return to step 3, "ADJUST Y DAMPING".
If phase of circle is still not perfect, repeat
damping and servo procedures for the X-axis while
slowly increasing or decreasing the servo gain.
In worst cases, repeat previous step until the circle is
perfectly phased and damping is correct. Refer to
figure 7.
7.
Adjust Image Size
Refer
to figure 3; A5.
Reset image signal size to normal at the signal
source.
Adjust X and Y image amplitudes to fill screen.
If screen area is not square, adjust sizes to
fill the largest square that fits on the screen.
The outside edge of the test pattern is the
maximum scan area.
Note: Newer test patterns may appear with ILDA test
pattern small inside a larger box. In this case, adjust the larger box to the
maximum screen size.
8.
Adjust DC Offset
Adjust
the DC offsets so the cross in the middle of the
test pattern is at the center of the screen area.
Make only minor adjustments with DC offsets. Larger adjustments should be made by
physically rotating the scanners in their mounts.
Tips:
-
Any
time you adjust servo gain, the damping(s) must
be adjusted as well. The inverse of this is also true.
-
Scanners
are inherently imperfect. A well adjusted XY set may be achieved
with some compromise to perfection. However, the scanners of today are of
higher quality and usually will tune near
perfectly. Be patient, don't give up too soon!
Scanner
Blanking
If you do not utilize scanner blanking, skip to section on AO blanking.
This procedure can also be used for tuning color modulation scanners.
9.
Adjust Blanking Damping
Refer to figure 3; B2.
Assuming you have some blanking, adjust the blanking
damping to evenly space the blank section of the
horizontal line on either side of the vertical mark.
See figure 8.
Note: Adjustment of the servo gain, dampening, and
input gain may require an adjustment of the blanking
offset in order to keep the image visible.
|

Incorrect
Incorrect
Correct
Figure
8 |
10.
Blanking Servo Gain
With
the damping correct, now examine the two horizontal
lines of B1. They should appear to converge at some point.
Regardless of whether they do or do not meet,
this point can be visualized through either a quick
visual average or extrapolation. See figure 9.
|

Average
Extrapolation
Extrapolation
Figure 9 - Apparent Convergence
|
If the apparent convergence is to the right of
the mark, increase the blanking servo gain unit it
is closer to being correct, then return to step 9, "ADJUST BLANKING DAMPENING".
If the apparent convergence is to the left of
the mark, decrease the blanking servo gain until it
is closer to being correct then return to step 9, "ADJUST BLANKING DAMPENING".
When the apparent convergence is on the mark and the
damping is correct, move to step 11.
11. Blanking Gain and DC Offset
Adjust
the DC offset until the fifth dot is barely visible
and the sixth dot is entirely blanked.
If the lines in B1 meet (roughly) at the mark, you
are done. Otherwise,
try a smaller input amplitude and adjust the DC
offset again. Refer
to figure 3; B1 and B3.
AO
Blanking
12.
Adjust Blanking Filter
If
blanking filters are not utilized by the projection
system being adjusted, no further adjustment is
necessary. For
AO systems without a blanking filter, a blanking
shift of positive five will roughly emulate the
blanking response defined by the ILDA Test Pattern.
A blanking shift will not however, produce
fading or blended lines or colors.
If a filter is used to process blanking signals,
adjust filter to emulate response as defined in
figures 8 and 9. Also adjust for blanking amplitude and offset
as defined by figure 3; B3 and B4.
Download
a copy of the ILDA Test Pattern [10 Kb]
Download a copy
of the ILDA B test pattern [11 Kb]
DISCLAIMER:
Some of the information in the Backstage area is provided by the persons or
companies named on the relevant page(s). Laser F/X does NOT endorse or
recommend any products/services and is NOT responsible for the technical
accuracy of the information provided. We provide this information as a
service to laserists using the Backstage area.
[
Introduction - System
Design - Scanning Systems
- Support
Equipment - Laser
Graphics - Show
Production - Pinouts ]
|